
Health inequalities and learning disability
People with a learning disability have worse physical and mental health than people without a learning disability.
Adults with a learning disability on average die 19 years younger than the general population (LeDeR, 2024 - published in 2026).
Poor quality healthcare causes avoidable deaths
The Confidential Confidential means something is private. Inquiry into premature deaths of people with a learning disability also found that 38% of people with a learning disability died from an avoidable cause, compared to 9% in a comparison population of people without a learning disability (Heslop et al. 2013, p. 92).
LeDeR found that 39% of deaths of people with a learning disability were avoidable (2024 LeDeR report, published in 2026).
Note: Mencap uses the term 'avoidable death' for deaths that could have been avoided by the provision of good quality healthcare.
Access to healthcare
A number of barriers are stopping people with a learning disability from getting good quality healthcare
These barriers include:
- a lack of
accessible
 Accessible means something is easy for people to use or join in with. For example: Accessible writing means the writing is easy to read and understand.
transport links
- patients not being identified as having a learning disability
- staff having little understanding about learning disability
- failure to recognise that a person with a learning disability is unwell
- failure to make a correct diagnosis A diagnosis is when a medical professional like a doctor has said you have a certain illness or condition.
- anxiety or a lack of confidence for people with a learning disability
- lack of joint working from different care providers
- not enough involvement allowed from carers
- inadequate aftercare or follow-up care.
(Heslop et al. 2013; Tuffrey-Wijnes et al. 2013; Allerton and Emerson 2012).
Health promotion initiatives
Annual health checks
55.1% of patients with a learning disability received an
annual health check
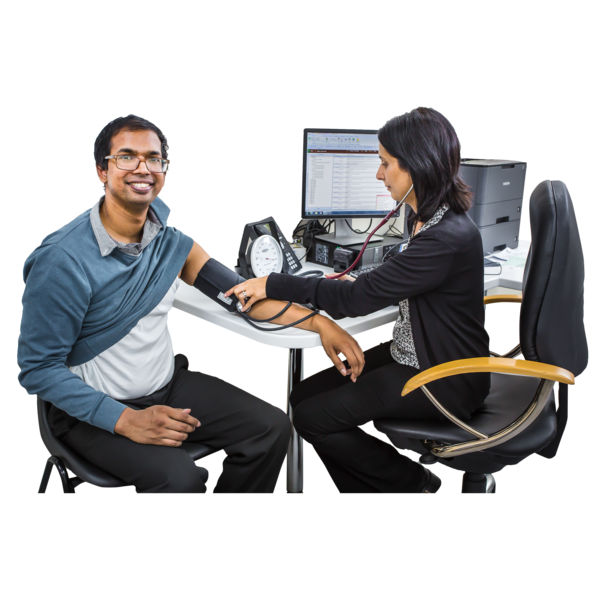 An annual health check is when you see a nurse or doctor once a year so they can help you stay well. Everyone aged 14 or over who has a learning disability should be invited for an annual health check.
in 2017-18, an increase from 49.7% in 2016-17 (
NHS
The NHS is the National Health Service. The NHS gives free healthcare to everyone in the UK and includes things like your GP (doctors) surgery and hospitals.
Digital 2019).
Percentage of adults with a learning disability who received annual health checks
Flu immunisation
44.9% of patients with a learning disability received flu immunisations in 2017-18, a small increase from 41.9% in 2016-17 to (NHS Digital 2019).
Cancer screening
In 2017/18, around half (52.5%) of women with a learning disability had been screened for breast cancer, compared to 68% of women without a learning disability.
Meanwhile, less than a third (31.2%) of eligible women with a learning disability had received cervical smear tests, in contrast to 73.2% of women with no learning disability.
Of those eligible for a colorectal cancer screening, 77.8% of people with a learning disability were screened, compared to 83.7% of those without (NHS Digital, 2019).
Associated health conditions
Common associated health conditions for people with a learning disability include mental health problems, epilepsy, and being underweight or overweight.
Click the conditions below to reveal more information.
In 2017/18 severe mental illness was 8.4 times more common in patients with a learning disability than those without.
In 2017/18, 13.3% of patients with a learning disability had an active diagnosis of depression, compared to 12.2% in 2014/15 (NHS Digital, 2019).
Research Research is a way of finding out information which could come from books, or asking people what they think. suggests that epilepsy is more common in adults with a learning disability than those without a learning disability; and is more common amongst men and those with a higher level of impairment (McGrother et al. 2006; Epilepsy Society, 2019 ; Robertson et al., 2015).
Estimates vary but in a review of 38 studies, the pooled estimate of prevalence of epilepsy in people with a learning disability was 22% (Robertson et al., 2015).
The proportion of people with a learning disability receiving body mass index (BMI) checks has increased from 58.3% in 2016/17 to 61.5% in 2017/18.
Of those receiving BMI checks, 6.4% of patients with a recorded learning disability were classified as underweight (BMI ≤18.4), this was higher than for those with no recorded learning disability (4.9%).
Meanwhile, 37.5% of people with a learning disability were classified as obese, this was also greater than those without a learning disability (29.9%) (NHS Digital, 2019).
The rate of dementia is high in all people with a learning disability, but is particularly high in people with Down’s syndrome.
In 2017/18, the prevalence rate for people with a learning disability aged 55-64 was 4.3%, compared to 0.3% of those with no learning disability.
For ages 65-74 it was 5.9% for people with a learning disability, compared to 1.1% for those without.
For those aged 75 and over it was 11.2% for people with a learning disability, compared to 8.7% for those without (NIHS Digital, 2019).
Reasonable adjustments
A lack of reasonable adjustments can be a barrier to accessing healthcare settings and to equal healthcare (Ali et al., 2013; Heslop et al., 2013).
The Confidential Inquiry into premature deaths of people with learning disabilities (CIPOLD) reviews showed the lack of reasonable adjustments provided to people with a learning disability (especially in accessing clinic appointments and investigations) as a contributory factor in a number of avoidable deaths (Heslop et al., 2013).
Healthcare professionals have a legal duty to provide reasonable adjustments for disabled people (Public Health England, 2016). This can include providing easy-read information, avoiding medical jargon or longer appointment times.
Research references
Here you'll find full referencing for the Mencap research and statistics pages.