
Adults in paid employment, by location:
England
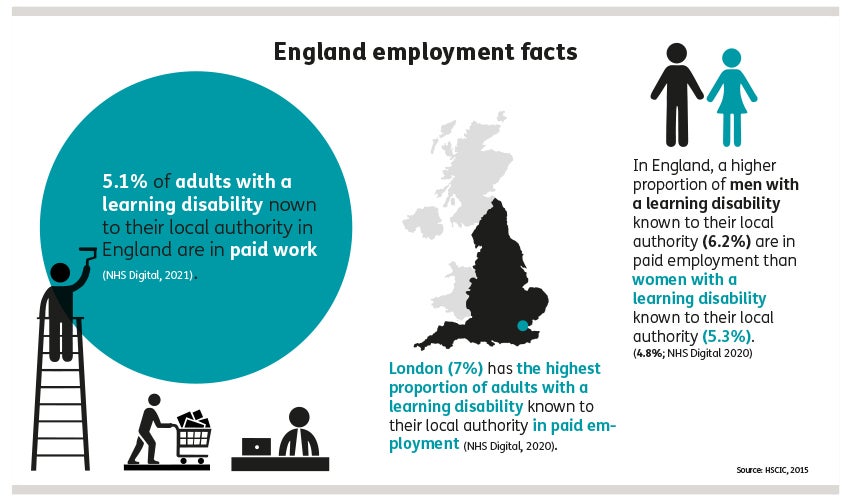
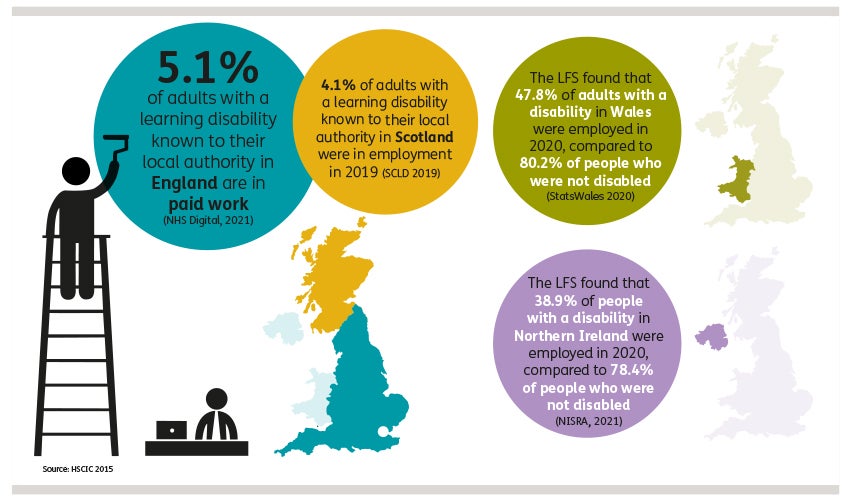
- 5.1% of adults with a
learning disability
 A learning disability is to do with the way someone's brain works. It makes it harder for someone to learn, understand or do things.
known to their
local authority
A learning disability is to do with the way someone's brain works. It makes it harder for someone to learn, understand or do things.
known to their
local authority
 A local authority is also called a
council
A local authority is also called a
council
 A council is also called a local authority. They are a group of people who make decisions about some of the things in the area where you live. These include: schools,
social care
A council is also called a local authority. They are a group of people who make decisions about some of the things in the area where you live. These include: schools,
social care
 Social care means the services that give care and support to people who need it.
(support for people), parks and dustbin collection.
. They are a group of people who make decisions about some of the things in the area where you live like schools, social care (support for people), parks and dustbin collection.
in England are in paid work (NHS Digital, 2021).
Social care means the services that give care and support to people who need it.
(support for people), parks and dustbin collection.
. They are a group of people who make decisions about some of the things in the area where you live like schools, social care (support for people), parks and dustbin collection.
in England are in paid work (NHS Digital, 2021). - The proportion of adults with a learning disability in paid
employment
 Employment means having a job.
varies by region.
Employment means having a job.
varies by region. - London (7%) and the South East (6.9%) have the highest proportion of adults with a learning disability known to their local authority in paid employment, followed by Yorkshire and the Humber (6.3%; NHS Digital 2020).
- In England, a higher proportion of men with a learning disability known to their local authority (6.2%) are in paid employment than women with a learning disability known to their local authority (4.8%; NHS Digital 2020).
Scotland
- 4.1% of adults with a learning disability known to their local authority in Scotland were in employment in 2019 (SCLD 2019).
Wales
- The Welsh government does not publish data on how many people with a learning disability in Wales are in paid work. However, the Labour Force
Survey
 A survey is when someone asks you to answer some questions.
(LFS) provides data on the economic activity of people in Wales aged 16-64 who have a disability according to the
Equality
A survey is when someone asks you to answer some questions.
(LFS) provides data on the economic activity of people in Wales aged 16-64 who have a disability according to the
Equality
 Equality is when everyone is treated fairly.
Act 2010 definition of disability.
Equality is when everyone is treated fairly.
Act 2010 definition of disability. - The LFS found that 47.8% of adults with a disability in Wales were employed in 2020, compared to 80.2% of people who were not disabled (StatsWales, 2020).
Northern Ireland
- The Northern Irish government does not publish data on how many people with a learning disability in Northern Ireland are in paid work. However, the LFS provides data on the economic activity of people in Northern Ireland aged 16-64 who describe themselves as having a long-term disability (NISRA, 2021).
- The LFS found that 38.9% of people with a disability in Northern Ireland were employed in 2020, compared to 78.4% of people who were not disabled (NISRA, 2021).
1 Mencap ran a survey with 1625 adults (aged 18+) with a learning disability in the UK. Responses were collected between January and July 2019 using a paper-based questionnaire and an online questionnaire.
References
NHS Digital (2021). Measures from the Adult Social Care Outcomes Framework, England - 2020-21
Northern Ireland Statistics and Research Agency (2021). Quarterly Labour Force Survey Tables
Office for National Statistics (2019). Disability and employment, UK: 2019
Office for National Statistics (2021). Employment in the UK: January 2021
SCLD (2019). Learning Disability Statistics Scotland, 2019
StatsWales (2020). Summary of economic activity by area and disabled status