
No Journey Left Behind addendum

No Journey Left Behind addendum
Survey
 A survey is when someone asks you to answer some questions.
descriptive statistics
This downloadable resource serves as supplementary information to the No Journey Left Behind report. It contains the full set of descriptive statistics collected during the research, including those that were featured in the main report and additional results that could not be included due to space constraints. The resource intends to provide a more comprehensive view of the data underpinning the findings presented in the main report. We hope that the resource enhances transparency and enables further analysis and interpretation of the results.
About you section
Completing the survey
| Frequency | Percent | Valid percent | Cumulative percent | ||
| Valid | On my own | 595 | 53.7 | 61.3 | 61.3 |
| Someone else is filling it in for me | 181 | 16.4 | 18.6 | 97.9 | |
| With a little bit of help | 129 | 11.7 | 13.3 | 93.2 | |
| With a lot of help | 66 | 6.0 | 6.8 | 100.0 | |
| Total | 971 | 97.7 | 100.0 | ||
| Missing | No response | 136 | 12.3 | ||
| Total | 1107 | 100.0 |
Disability type
| Responses N | Percent | Percent of cases | ||
| Type | Learning disability A learning disability is to do with the way someone's brain works. It makes it harder for someone to learn, understand or do things. | 747 | 30.5 | 71.3 |
Physical disability
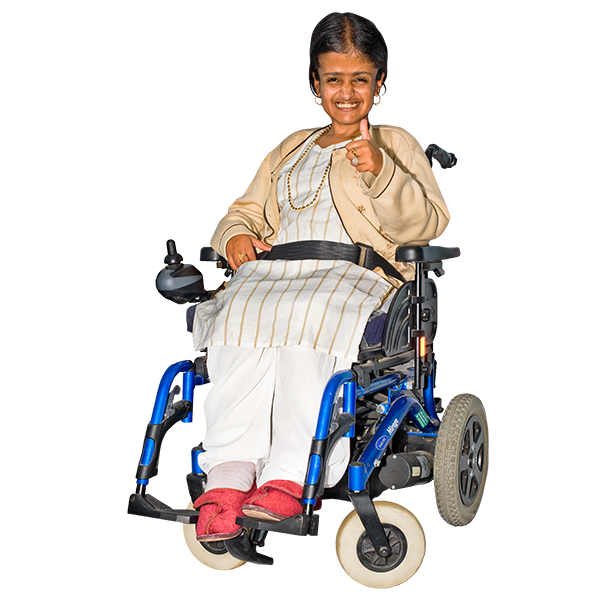 A physical disability is to do with your body. You might find it hard to do some things like walk or lift things. | 298 | 12.2 | 28.5 | |
| Sensory disability | 200 | 8.2 | 19.1 | |
| Long-term health disability | 350 | 14.3 | 33.4 | |
| Mental health condition | 318 | 13.0 | 30.4 | |
| Neurodivergence | 266 | 10.9 | 25.4 | |
| Different disability | 121 | 4.9 | 11.6 | |
| Prefer not to say - disability | 146 | 6.0 | 13.9 | |
| Total | 2446 | 100.0 | 233.6 | |
| Total responses | 1047 | |||
| Missing response | 60 |
Number of co-occurring disabilities
| Frequency | Percent | Valid percent | Cumulative percent | ||
| Valid | 0 | 343 | 31.0 | 32.7 | 32.7 |
| 1 | 312 | 28.2 | 29.8 | 62.5 | |
| 2 | 181 | 16.4 | 17.3 | 79.8 | |
| 3 | 99 | 8.9 | 9.4 | 89.2 | |
| 4 | 38 | 3.4 | 3.6 | 92.8 | |
| 5 | 19 | 1.7 | 1.8 | 94.7 | |
| 6 | 56 | 5.1 | 5.3 | 100.0 | |
| Total | 1048 | 94.7 | 100.0 | ||
| Missing | No response | 59 | 5.3 | ||
| Total | 1107 | 100.0 |
Age
| Frequency | Percent | Valid percent | Cumulative percent | ||
| Valid | 18-24 years | 148 | 13.4 | 15.3 | 15.3 |
| 25-34 years | 233 | 21.0 | 24.0 | 39.3 | |
| 35-44 years | 209 | 18.9 | 21.6 | 60.9 | |
| 45-54 years | 156 | 14.1 | 16.1 | 77.0 | |
| 55-64 years | 118 | 10.7 | 12.2 | 89.2 | |
| 65-74 years | 66 | 6.0 | 6.8 | 96.0 | |
| 75+ years | 39 | 3.5 | 4.0 | 100.0 | |
| Total | 969 | 87.5 | 100.0 | ||
| Missing | Prefer not to say | 26 | 2.3 | ||
| No response | 112 | 10.1 | |||
| Total | 138 | 12.5 | |||
| Total | 1107 | 100.0 |
Gender
 Your gender is how you think of yourself. Most people think of themselves as a man or woman. Some people think of themselves as non-binary.
| Frequency | Percent | Valid percent | Cumulative percent | ||
| Valid | Man | 427 | 38.6 | 45.7 | 45.7 |
| Woman | 494 | 44.6 | 52.9 | 98.6 | |
| Non-binary | 11 | 1.0 | 1.2 | 99.8 | |
| Other | 2 | 0.2 | 0.2 | 100.0 | |
| Total | 934 | 84.4 | 100.0 | ||
| Missing | Prefer not to say | 24 | 2.2 | ||
| No response | 149 | 13.5 | |||
| Total | 173 | 15.6 |
Gender identity
| Frequency | Percent | Valid percent | Cumulative percent | ||
| Valid | Yes | 26 | 2.3 | 3.0 | 3.0 |
| No | 850 | 76.8 | 96.6 | 99.5 | |
| I use another term | 4 | 0.4 | 0.5 | 100.0 | |
| Total | 880 | 79.5 | 100.0 | ||
| Missing | Prefer not to say | 38 | 3.4 | ||
| No response | 189 | 17.1 | |||
| Total | 227 | 20.5 | |||
| Total | 1107 | 100.0 |
Sexual orientation
| Frequency | Percent | Valid percent | Cumulative percent | ||
| Valid | Straight/heterosexual | 604 | 54.6 | 84.1 | 84.1 |
Gay
 Gay means a man who fancies other men, or a woman who fancies other women.
/
lesbian  A lesbian is a woman who fancies other women.
/homosexual | 29 | 2.6 | 4.0 | 88.2 | |
Bi/
bisexual
 A bisexual is someone who fancies men and women. | 34 | 3.1 | 4.7 | 92.9 | |
| Asexual | 34 | 3.1 | 4.7 | 97.6 | |
| Pansexual | 8 | 0.7 | 1.1 | 98.7 | |
| I use another term | 9 | 0.8 | 1.3 | 100.0 | |
| Total | 718 | 64.9 | 100.0 | ||
| Missing | I prefer not to say | 207 | 18.7 | ||
| No response | 182 | 16.4 | |||
| Total | 389 | 35.1 | |||
| Total | 1107 | 100.0 |
Ethnicity
| Frequency | Percent | Valid percent | Cumulative percent | ||
| Valid | White | 744 | 67.2 | 83.4 | 83.4 |
| Black, Black British, Caribbean or African | 70 | 6.3 | 7.8 | 91.3 | |
| Asian or Asian British | 41 | 3.7 | 4.6 | 95.9 | |
| Mixed or Multiple Ethnic group | 22 | 2.0 | 2.5 | 98.3 | |
| A different ethnic group | 15 | 1.4 | 1.7 | 100.0 | |
| Total | 892 | 80.6 | 100.0 | ||
| Missing | Prefer not to say | 43 | 3.9 | ||
| No response | 172 | 15.5 | |||
| Total | 215 | 19.4 | |||
| Total | 1107 | 100.0 |
Urban/rural classification
| Frequency | Percent | Valid percent | Cumulative percent | ||
| Valid | Urban major conurbation | 243 | 22.0 | 31.6 | 31.6 |
| Urban minor conurbation | 46 | 4.2 | 6.0 | 37.6 | |
| Urban city and town | 382 | 34.5 | 49.7 | 87.4 | |
| Urban city and town in sparse setting | 5 | 0.5 | 0.7 | 88.0 | |
| Rural town and fringe | 61 | 5.5 | 7.9 | 96.0 | |
| Rural village and hamlet | 22 | 2.0 | 2.9 | 98.8 | |
| Rural village and hamlet in sparse setting | 9 | 0.8 | 1.2 | 100.0 | |
| Total | 768 | 69.4 | 100.0 | ||
| Missing | Prefer not to say | 2 | 0.2 | ||
| No response | 337 | 30.4 | |||
| Total | 339 | 30.6 | |||
| Total | 1107 | 100.0 |
Geographical location
| Frequency | Percent | Valid percent | Cumulative percent | ||
| Valid | East Midlands | 55 | 5.0 | 6.7 | 6.7 |
| East of England | 80 | 7.2 | 9.7 | 16.4 | |
| London | 98 | 8.9 | 11.9 | 29.3 | |
| North West | 57 | 5.1 | 6.9 | 35.3 | |
| Northern Ireland | 48 | 4.3 | 5.8 | 41.1 | |
| Scotland | 39 | 3.5 | 4.7 | 45.9 | |
| South West | 69 | 6.2 | 8.4 | 54.3 | |
| Wales | 69 | 6.2 | 8.4 | 62.7 | |
| West Midlands | 63 | 5.7 | 7.7 | 70.3 | |
| Yorkshire and the Humber | 100 | 9.0 | 12.2 | 82.5 | |
| South East | 120 | 10.8 | 14.6 | 97.1 | |
| North East | 24 | 2.2 | 2.9 | 100.0 | |
| Total | 822 | 74.3 | 100.0 | ||
| Missing | Prefer not to say | 3 | 0.3 | ||
| No response | 282 | 25.5 | |||
| Total | 285 | 25.7 | |||
| Total | 1107 | 100.0 |
Living arrangements
Where do you live?
| Frequency | Percent | Valid percent | Cumulative percent | ||
| Valid | In a house or flat | 732 | 66.1 | 79.7 | 79.7 |
| In supported housing | 121 | 10.9 | 13.2 | 92.8 | |
| In a caravan or mobile home | 1 | 0.1 | 0.1 | 92.9 | |
| In a long stay hospital | 2 | 0.2 | 0.2 | 93.1 | |
In residential care, or in a
care home
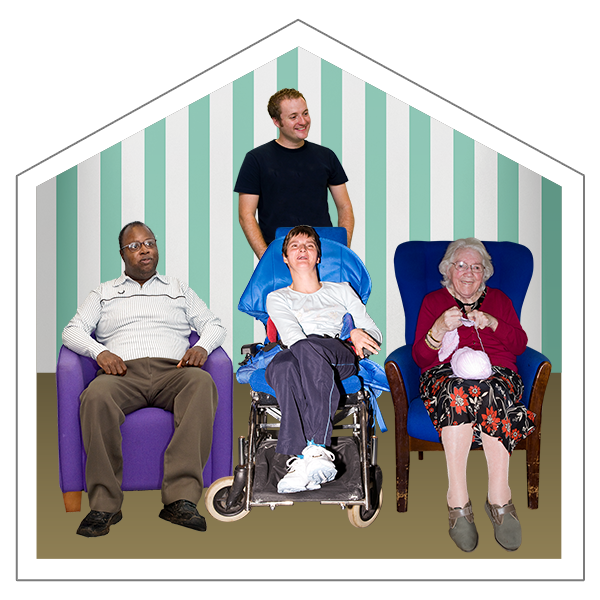 A care home is a place where people who need support live. There are staff there all the time. | 26 | 2.3 | 2.8 | 96.0 | |
| Somewhere else | 37 | 3.3 | 4.0 | 100.0 | |
| Total | 919 | 83.0 | 100.0 | ||
| Missing | No response | 188 | 17.0 | ||
| Total | 1107 | 100.0 |
Who do you live with?
| Responses N | Percent | Percent of cases | ||
| Living on my own | 353 | 16.2 | 38.7 | |
| Living with friends | 272 | 12.5 | 29.8 | |
| Living with parents | 419 | 19.2 | 45.9 | |
| Living with partner | 274 | 12.6 | 30.0 | |
| Living with children | 220 | 10.1 | 24.1 | |
| Living with other family members | 232 | 10.7 | 25.4 | |
Living with a paid
support worker
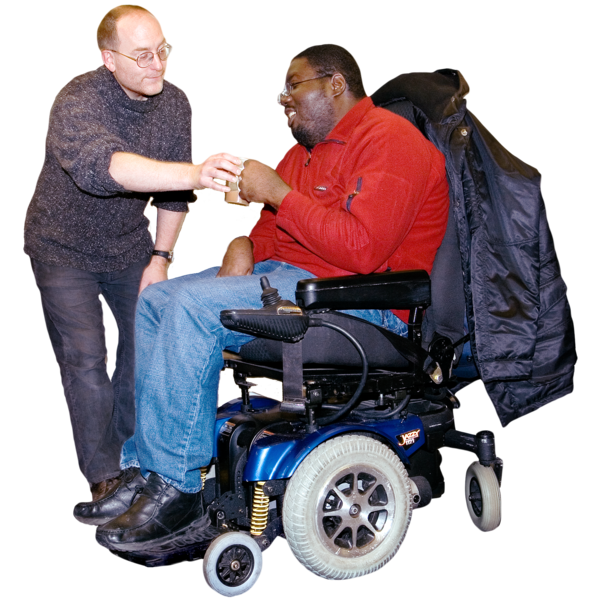 Support workers are people who are paid to give care and support to people who need it. | 209 | 9.6 | 22.9 | |
| Living with someone else | 198 | 9.1 | 21.7 | |
| Total | 2177 | 100.0 | 238.7 |
Driving
| Frequency | Percent | Valid percent | Cumulative percent | ||
| Valid | No | 764 | 69.0 | 85.5 | 85.5 |
| Yes | 130 | 11.7 | 14.5 | 100.0 | |
| Total | 894 | 80.8 | 100.0 | ||
| Missing | No response | 231 | 19.2 | ||
| Total | 1107 | 100.0 |
Public transport section
Frequency
How often do you use public transport?
| Frequency | Percent | Valid percent | Cumulative percent | ||
| Valid | Every day | 270 | 24.4 | 27.6 | 27.6 |
| Once or a few times a week | 368 | 33.2 | 37.6 | 65.2 | |
| Once or a few times a month | 117 | 10.6 | 12.0 | 77.1 | |
| Once very few months | 47 | 4.2 | 4.8 | 81.9 | |
| Rarely | 116 | 10.5 | 11.8 | 93.8 | |
| Never | 61 | 5.5 | 6.2 | 100.0 | |
| Total | 979 | 88.4 | 100.0 | ||
| Missing | No response | 128 | 11.6 | ||
| Total | 1107 | 100.0 |
Type of transport used
What type of public transport do you use?
| Frequency | Percent | ||
| Valid | Bus | 792 | 86.7 |
| Train | 557 | 60.9 | |
| Underground | 289 | 31.6 | |
| Light railway | 252 | 27.6 | |
| Taxi | 489 | 53.5 | |
| Scooter | 211 | 23.1 | |
| Ferry/boat | 228 | 24.9 | |
| Aeroplane | 260 | 28.4 | |
| Different transport | 222 | 24.3 | |
| Total | 914 | 82.5 | |
| Missing | No response | 193 | 17.4 |
| Total | 1107 | 100.0 |
Count of transport modes used
| Frequency | Percent | Valid percent | Cumulative percent | ||
| Valid | 1 | 198 | 17.9 | 21.7 | 21.7 |
| 2 | 197 | 17.8 | 21.6 | 43.2 | |
| 3 | 174 | 15.7 | 19.0 | 62.3 | |
| 4 | 58 | 5.2 | 6.3 | 68.6 | |
| 5 | 15 | 1.4 | 1.6 | 70.2 | |
| 6 | 3 | 0.3 | 0.3 | 70.6 | |
| 7 | 4 | 0.4 | 0.4 | 71.0 | |
| 8 | 3 | 0.3 | 0.3 | 71.3 | |
| 9 | 201 | 18.2 | 22.0 | 93.3 | |
| Not applicable | 61 | 5.5 | 6.7 | 100.0 | |
| Total | 914 | 82.6 | 100.0 | ||
| Missing | No response | 193 | 17.4 | ||
| Total | 1107 | 100.0 |
Bus
| Frequency | Percent | Valid percent | Cumulative percent | ||
| Valid | Yes | 792 | 71.5 | 86.7 | 86.7 |
| No | 61 | 5.5 | 6.7 | 93.3 | |
| Not applicable | 61 | 5.5 | 6.7 | 100.0 | |
| Total | 914 | 82.6 | 100.0 | ||
| Missing | No response | 193 | 17.4 | ||
| Total | 1107 | 100.0 |
Train
| Frequency | Percent | Valid percent | Cumulative percent | ||
| Valid | Yes | 557 | 50.3 | 60.9 | 60.9 |
| No | 296 | 26.7 | 32.4 | 93.3 | |
| Not applicable | 61 | 5.5 | 6.7 | 100.0 | |
| Total | 914 | 82.6 | 100.0 | ||
| Missing | No response | 193 | 17.4 | ||
| Total | 1107 | 100.0 |
Underground
| Frequency | Percent | Valid percent | Cumulative percent | ||
| Valid | Yes | 289 | 26.1 | 31.6 | 31.6 |
| No | 564 | 50.9 | 61.7 | 93.3 | |
| Not applicable | 61 | 5.5 | 6.7 | 100.0 | |
| Total | 914 | 82.6 | 100.0 | ||
| Missing | No response | 193 | 17.4 | ||
| Total | 1107 | 100.0 |
Light railway
| Frequency | Percent | Valid percent | Cumulative percent | ||
| Valid | Yes | 252 | 22.8 | 27.6 | 27.6 |
| No | 601 | 54.3 | 65.8 | 93.3 | |
| Not applicable | 61 | 5.5 | 6.7 | 100.0 | |
| Total | 914 | 82.6 | 100.0 | ||
| Missing | No response | 193 | 17.4 | ||
| Total | 1107 | 100.0 |
Taxi
| Frequency | Percent | Valid percent | Cumulative percent | ||
| Valid | Yes | 489 | 44.2 | 53.5 | 53.5 |
| No | 364 | 62.9 | 39.8 | 93.3 | |
| Not applicable | 61 | 5.5 | 6.7 | 100.0 | |
| Total | 914 | 82.6 | 100.0 | ||
| Missing | No response | 193 | 17.4 | ||
| Total | 1107 | 100.0 |
Scooter
| Frequency | Percent | Valid percent | Cumulative percent | ||
| Valid | Yes | 211 | 19.1 | 23.1 | 23.1 |
| No | 642 | 58.0 | 70.2 | 93.3 | |
| Not applicable | 61 | 5.5 | 6.7 | 100.0 | |
| Total | 914 | 82.6 | 100.0 | ||
| Missing | No response | 193 | 17.4 | ||
| Total | 1107 | 100.0 |
Ferry/boat
| Frequency | Percent | Valid percent | Cumulative percent | ||
| Valid | Yes | 228 | 20.6 | 24.9 | 24.9 |
| No | 625 | 56.5 | 68.4 | 93.3 | |
| Not applicable | 61 | 5.5 | 6.7 | 100.0 | |
| Total | 914 | 82.6 | 100.0 | ||
| Missing | No response | 193 | 17.4 | ||
| Total | 1107 | 100.0 |
Aeroplane
| Frequency | Percent | Valid percent | Cumulative percent | ||
| Valid | Yes | 260 | 23.5 | 28.4 | 28.4 |
| No | 593 | 53.6 | 64.9 | 93.3 | |
| Not applicable | 61 | 5.5 | 6.7 | 100.0 | |
| Total | 914 | 82.6 | 100.0 | ||
| Missing | No response | 193 | 17.4 | ||
| Total | 1107 | 100.0 |
Different transport
| Frequency | Percent | Valid percent | Cumulative percent | ||
| Valid | Yes | 222 | 20.1 | 24.3 | 24.3 |
| No | 631 | 57.0 | 69.0 | 93.3 | |
| Not applicable | 61 | 5.5 | 6.7 | 100.0 | |
| Total | 914 | 82.6 | 100.0 | ||
| Missing | No response | 193 | 17.4 | ||
| Total | 1107 | 100.0 |
Help using public transport
| Frequency | Percent | Valid percent | ||
| Valid | I can do this on my own | 400 | 36.1 | 48.1 |
| I need a bit of help | 220 | 19.9 | 26.4 | |
| I need a lot of help | 66 | 6.0 | 7.9 | |
| I can't use public transport without help | 146 | 13.2 | 17.5 | |
| Total | 832 | 75.2 | 100.0 | |
| Missing | No response | 275 | 24.8 | |
| Total | 1107 | 100.0 |
Who helps you to use public transport?
| Responses N | Percent | Percent of cases | ||
| Family | 375 | 23.7 | 87.2 | |
| Friends | 311 | 19.6 | 72.3 | |
| Paid support worker | 335 | 21.1 | 77.9 | |
| Transport staff | 296 | 18.7 | 68.8 | |
| Other - helpPT | 268 | 16.9 | 62.3 | |
| Total | 1585 | 100.0 | 368.6 | |
| Total respondents | 828 | |||
| Missing responses | 279 |
Public transport usage
What do you use public transport for?
| Responses N | Percent | Percent of cases | ||
| Go out in my community A community is the people and places in an area. | 580 | 15.9 | 70.7 | |
| Go shopping | 592 | 16.2 | 72.2 | |
| Go to health appointments | 485 | 13.3 | 59.1 | |
| Go to work | 388 | 10.6 | 47.3 | |
| Go to school or college | 294 | 8.0 | 35.9 | |
| See friends or family | 523 | 14.3 | 63.8 | |
| Travel to other places | 525 | 14.3 | 64.0 | |
| Something else | 272 | 7.4 | 33.2 | |
| Total | 3659 | 100.0 | 446.2 | |
| Total respondents | 820 | |||
| Missing responses | 287 |
Easy or difficult statements
Planning your journey
| Frequency | Percent | Valid percent | Cumulative percent | ||
| Valid | Very easy | 179 | 16.2 | 20.9 | 20.9 |
| Easy | 133 | 12.0 | 15.5 | 26.4 | |
| It is okay | 237 | 21.4 | 27.7 | 64.1 | |
| Difficult | 144 | 13.0 | 16.8 | 81.0 | |
| Very difficult | 163 | 14.7 | 19.0 | 100.0 | |
| Total | 856 | 77.3 | 100.0 | ||
| Missing | No response | 251 | 22.7 | ||
| Total | 1107 | 100.0 |
Reading timetables
| Frequency | Percent | Valid percent | Cumulative percent | ||
| Valid | Very easy | 126 | 11.4 | 15.7 | 15.7 |
| Easy | 96 | 8.7 | 11.9 | 27.6 | |
| It is okay | 191 | 17.3 | 23.8 | 51.4 | |
| Difficult | 174 | 15.7 | 21.6 | 73.0 | |
| Very difficult | 217 | 19.6 | 27.0 | 100.0 | |
| Total | 804 | 72.6 | 100.0 | ||
| Missing | No response | 303 | 27.4 | ||
| Total | 1107 | 100.0 |
Getting to the station or stop
| Frequency | Percent | Valid percent | Cumulative percent | ||
| Valid | Very easy | 185 | 16.7 | 22.3 | 22.3 |
| Easy | 171 | 15.4 | 20.7 | 43.0 | |
| It is okay | 244 | 22.0 | 29.5 | 72.5 | |
| Difficult | 120 | 10.8 | 14.5 | 87.0 | |
| Very difficult | 108 | 9.8 | 13.0 | 100.0 | |
| Total | 828 | 74.8 | 100.0 | ||
| Missing | No response | 279 | 25.2 | ||
| Total | 1107 | 100.0 |
Buying tickets
| Frequency | Percent | Valid percent | Cumulative percent | ||
| Valid | Very easy | 161 | 14.5 | 20.3 | 20.3 |
| Easy | 151 | 13.6 | 19.0 | 39.3 | |
| It is okay | 210 | 19.0 | 26.4 | 65.7 | |
| Difficult | 138 | 12.5 | 17.4 | 83.1 | |
| Very difficult | 134 | 12.1 | 16.9 | 100.0 | |
| Total | 794 | 71.7 | 100.0 | ||
| Missing | No response | 313 | 28.3 | ||
| Total | 1107 | 100.0 |
Getting on public transport
| Frequency | Percent | Valid percent | Cumulative percent | ||
| Valid | Very easy | 208 | 18.8 | 25.2 | 25.2 |
| Easy | 162 | 14.6 | 19.6 | 44.7 | |
| It is okay | 239 | 21.6 | 28.9 | 73.6 | |
| Difficult | 111 | 10.0 | 13.4 | 87.1 | |
| Very difficult | 107 | 9.7 | 12.9 | 100.0 | |
| Total | 827 | 74.7 | 100.0 | ||
| Missing | No response | 280 | 25.3 | ||
| Total | 1107 | 100.0 |
Finding a seat
| Frequency | Percent | Valid percent | Cumulative percent | ||
| Valid | Very easy | 150 | 13.6 | 18.3 | 18.3 |
| Easy | 159 | 14.4 | 19.4 | 37.8 | |
| It is okay | 234 | 21.1 | 28.6 | 66.4 | |
| Difficult | 161 | 14.5 | 19.7 | 86.1 | |
| Very difficult | 114 | 10.3 | 13.9 | 100.0 | |
| Total | 818 | 83.9 | 100.0 | ||
| Missing | No response | 289 | 26.1 | ||
| Total | 1107 | 100.0 |
Getting off at the right stop
| Frequency | Percent | Valid percent | Cumulative percent | ||
| Valid | Very easy | 185 | 16.7 | 22.3 | 22.3 |
| Easy | 188 | 17.0 | 22.6 | 44.9 | |
| It is okay | 225 | 20.3 | 27.1 | 72.0 | |
| Difficult | 116 | 10.5 | 14.0 | 85.9 | |
| Very difficult | 117 | 10.6 | 14.1 | 100.0 | |
| Total | 831 | 75.1 | 100.0 | ||
| Missing | No response | 276 | 24.9 | ||
| Total | 1107 | 100.0 |
Public transport barriers
What stops you from using public transport?
| Responses N | Percent | Percent of cases | ||
| It is hard to understand | 396 | 10.0 | 48.1 | |
| It does not meet my physical needs | 306 | 7.7 | 37.1 | |
| It makes me feel stressed | 507 | 12.8 | 61.5 | |
| It is too crowded | 543 | 13.7 | 65.9 | |
| It is often late | 475 | 12.0 | 57.6 | |
| Not enough public transport near me or it does not come often enough | 403 | 10.2 | 48.9 | |
| I only feel confident travelling at certain Certain means you are sure about something. times of the day | 379 | 9.6 | 46.0 | |
| My travel pass only works at certain times | 355 | 9.0 | 43.1 | |
| Not enough staff at my station | 294 | 7.4 | 35.7 | |
| Something else | 305 | 7.7 | 37.0 | |
| Total | 3963 | 100.0 | 480.9 | |
| Total respondents | 824 | |||
| Missing respondents | 283 |
Count of public transport barriers
| Frequency | Percent | Valid Percent | Cumulative percent | ||
| Valid | 1 | 173 | 15.6 | 21.0 | 21.0 |
| 2 | 109 | 9.8 | 13.2 | 34.2 | |
| 3 | 110 | 9.9 | 13.3 | 47.6 | |
| 4 | 95 | 8.6 | 11.5 | 59.1 | |
| 5 | 57 | 5.1 | 6.9 | 66.0 | |
| 6 | 39 | 3.5 | 4.7 | 70.8 | |
| 7 | 18 | 1.6 | 2.2 | 72.9 | |
| 8 | 4 | 0.4 | 0.5 | 73.4 | |
| 9 | 5 | 0.5 | 0.6 | 74.0 | |
| 10 | 214 | 19.3 | 26.0 | 100.0 | |
| Total | 824 | 74.4 | 100.0 | ||
| Missing | No response | 283 | 25.6 | ||
| Total | 1107 | 100.0 |
Wellbeing section
Think about the past month. What feeling have you felt the most?
| Frequency | Percent | Valid Percent | Cumulative percent | ||
| Valid | Angry | 63 | 5.7 | 6.8 | 6.8 |
| Confident | 141 | 12.7 | 15.3 | 22.2 | |
| Excited | 45 | 4.1 | 4.9 | 27.1 | |
| Happy | 270 | 24.4 | 29.3 | 56.4 | |
| Lonely | 57 | 5.1 | 6.2 | 62.6 | |
| Sad | 57 | 5.1 | 6.2 | 68.8 | |
| Worried | 205 | 18.5 | 22.3 | 91.1 | |
| Something else | 82 | 7.4 | 8.9 | 100.0 | |
| Total | 920 | 83.1 | 100.0 | ||
| Missing | No response | 187 | 16.9 | ||
| Total | 1107 | 100.0 |
How does using public transport make you feel?
| Responses N | Percent | Percent of cases | ||
| Angry | 280 | 10.9 | 32.3 | |
| Confident | 343 | 13.4 | 39.6 | |
| Excited | 285 | 11.1 | 32.9 | |
| Happy | 414 | 16.2 | 47.8 | |
| Lonely | 247 | 9.6 | 28.5 | |
| Sad | 254 | 9.9 | 29.3 | |
| Worried | 457 | 17.8 | 52.8 | |
| Other feeling | 283 | 11.0 | 32.7 | |
| Total respondents | 866 | |||
| Missing respondents | 241 | |||
| Total | 2563 | 100.0 | 296.0 | |
| Total respondents | 866 | |||
| Missing respondents | 241 |
Community section
Think about the past month. Were there any times you didn't go out because you were worried about using public transport?
| Frequency | Percent | Valid Percent | Cumulative percent | ||
| Valid | Yes | 333 | 30.1 | 38.8 | 38.8 |
| No | 451 | 40.7 | 52.6 | 91.4 | |
| I don not use public transport | 74 | 6.7 | 8.6 | 100.0 | |
| Total | 858 | 77.5 | 100.0 | ||
| Missing | No response | 249 | 22.5 | ||
| Total | 1107 | 100.0 |
What were you worried about?
| Responses N | Percent | Percent of cases | ||
| Asking a member of the public for help | 56 | 16.2 | 50.5 | |
| Asking transport staff for help | 63 | 18.2 | 56.8 | |
| Getting lost | 69 | 19.9 | 62.2 | |
| People calling me names or bullying me | 44 | 12.7 | 39.6 | |
| People ignoring me | 39 | 11.3 | 35.1 | |
| People laughing at me | 45 | 13.0 | 40.5 | |
| Something else | 30 | 8.7 | 27.0 | |
| Total | 346 | 100.0 | 311.7 |
Do you feel safe using public transport?
| Frequency | Percent | Valid Percent | Cumulative percent | ||
| Valid | Yes | 358 | 32.3 | 42.1 | 42.1 |
| Sometimes | 333 | 30.1 | 39.1 | 81.2 | |
| No | 105 | 9.5 | 12.3 | 93.5 | |
| I do not use public transport | 55 | 5.0 | 6.5 | 100.0 | |
| Total | 851 | 76.9 | 100.0 | ||
| Missing | No response | 256 | 23.1 | ||
| Total | 1107 | 100.0 |
Money section
How much do you agree or disagree? "I have enough money to buy what I need to live a happy and healthy life." For example, paying for food, transport, rent, bills and doing things with family and friends.
| Frequency | Percent | Valid Percent | Cumulative percent | ||
| Valid | Strongly agree | 168 | 15.2 | 18.6 | 18.6 |
| Agree | 292 | 26.4 | 32.4 | 51.0 | |
| Neither agree nor disagree | 187 | 16.9 | 20.7 | 71.7 | |
| Disagree | 103 | 9.3 | 11.4 | 83.1 | |
| Strongly disagree | 87 | 7.9 | 9.6 | 92.8 | |
| Someone else pays for things | 65 | 5.9 | 7.2 | 100.0 | |
| Total | 902 | 81.5 | 100.0 | ||
| Missing | No response | 205 | 18.5 | ||
| Total | 1107 | 100.0 |
Does the cost of public transport stop you from using it?
| Frequency | Percent | Valid Percent | Cumulative percent | ||
| Valid | Yes | 105 | 9.5 | 12.3 | 12.3 |
| Sometimes | 146 | 13.2 | 17.1 | 29.3 | |
| No | 219 | 19.8 | 25.6 | 54.9 | |
| Someone else pays for it | 19 | 1.7 | 2.2 | 57.1 | |
| I have a travel pass | 367 | 33.2 | 42.9 | 100.0 | |
| Total | 856 | 77.3 | 100.0 | ||
| Missing | No response | 251 | 22.7 | ||
| Total | 1107 | 100.0 |
Work section
Paid job/volunteering
| Responses N | Percent | Percent of cases | ||
| I have a paid job | 233 | 29.3 | 31.7 | |
| I volunteer | 208 | 26.2 | 28.3 | |
| I do not have a paid job and I do not volunteer | 354 | 44.5 | 48.2 | |
| Total | 795 | 100.0 | 108.2 | |
| Missing responses | 312 |
Do you want to have a paid job?
| Frequency | Percent | Valid Percent | Cumulative percent | ||
| Valid | Yes | 194 | 17.5 | 46.6 | 46.6 |
| No | 222 | 20.1 | 53.4 | 100.0 | |
| Total | 416 | 37.6 | 100.0 | ||
| Missing | Not applicable | 274 | 24.8 | ||
| No response | 417 | 37.7 | |||
| Total | 691 | 62.4 | |||
| Total | 1107 | 100.0 |
On the job barriers
Things that make it harder to work
| Responses N | Percent | Percent of cases | ||
| Using public transport is difficult | 129 | 11.2 | 89.0 | |
| My travel pass only works at certain times | 130 | 11.3 | 89.7 | |
| Not enough public transport near me, or it does not come often enough | 132 | 11.5 | 91.0 | |
| Being treated differently because I have a learning disability | 128 | 11.1 | 88.3 | |
| I will receive less benefits | 129 | 11.2 | 89.0 | |
| I will not be supported at work | 126 | 11.0 | 86.9 | |
Job applications are not
accessible
 Accessible means something is easy for people to use or join in with. For example: Accessible writing means the writing is easy to read and understand. | 124 | 10.8 | 85.5 | |
| Working is hard on my body and mind | 128 | 11.1 | 88.3 | |
| Something else | 124 | 10.8 | 85.5 | |
| Total | 1150 | 100.0 | 793.1 | |
| Total respondents | 804 | |||
| Missing respondents | 303 |
Count of barriers to going to work
| Frequency | Percent | Valid Percent | Cumulative percent | ||
| Valid | 0 | 33 | 3.0 | 18.5 | 18.5 |
| 1 | 8 | 0.7 | 4.5 | 23.0 | |
| 2 | 7 | 0.6 | 3.9 | 27.0 | |
| 3 | 3 | 0.3 | 1.7 | 28.7 | |
| 4 | 3 | 0.3 | 1.7 | 30.3 | |
| 5 | 2 | 0.2 | 1.1 | 31.5 | |
| 8 | 1 | 0.1 | 0.6 | 32.0 | |
| 9 | 121 | 10.9 | 68.0 | 100.0 | |
| Total | 178 | 16.1 | 100.0 | ||
| Missing | 99 | 626 | 56.5 | ||
| 999 | 303 | 27.4 | |||
| Total | 929 | 83.9 | |||
| Total | 1107 | 100.0 |
Barriers to getting a job
Barriers to getting a paid job
| Responses N | Percent | Percent of cases | ||
| Using public transport is difficult | 288 | 11.0 | 76.4 | |
| My travel pass only works at certain times | 277 | 10.6 | 73.5 | |
| Not enough public transport near me, or it does not come often enough | 282 | 10.8 | 74.8 | |
| Being treated differently because I have a learning disability | 312 | 11.9 | 82.8 | |
| I will recieve less benefits | 283 | 10.8 | 75.1 | |
| I will not be supported at work | 306 | 11.7 | 81.2 | |
| Job applications are not accessible | 287 | 11.0 | 76.1 | |
| Working is hard on my body or mind | 300 | 11.5 | 79.6 | |
| Something else | 276 | 10.6 | 73.2 | |
| Total | 2611 | 100.0 | 692.6 | |
| Total respondents | 651 | |||
| Missing respondents | 456 |
Count of barriers stopping people getting a job
| Frequency | Percent | Valid Percent | Cumulative percent | ||
| Valid | 1 | 39 | 3.5 | 10.3 | 10.3 |
| 2 | 24 | 2.2 | 6.4 | 16.7 | |
| 3 | 24 | 2.2 | 6.4 | 23.1 | |
| 4 | 14 | 1.3 | 3.7 | 26.8 | |
| 5 | 13 | 1.2 | 3.4 | 30.2 | |
| 6 | 7 | 0.6 | 1.9 | 32.1 | |
| 7 | 6 | 0.5 | 1.6 | 33.7 | |
| 8 | 3 | 0.3 | 0.8 | 34.5 | |
| 9 | 247 | 22.3 | 65.5 | 100.0 | |
| Total | 377 | 34.1 | 100.0 | ||
| Missing | 99 | 274 | 24.8 | ||
| 999 | 456 | 41.2 | |||
| Total | 730 | 65.9 | |||
| Total | 1107 | 100.0 |
Getting support to find a job
| Responses N | Percent | Percent of cases | ||
| Yes, from a family member | 11 | 15.7 | 21.6 | |
| Yes, from a job coach | 7 | 10.0 | 13.7 | |
| Yes, from a job centre | 4 | 5.7 | 7.8 | |
| Yes, from a support worker | 12 | 17.1 | 23.5 | |
Yes, from a supported
employment
 Employment means having a job.
program | 13 | 18.6 | 25.5 | |
| Other | 6 | 8.6 | 11.8 | |
| No, I have not received any help | 17 | 24.3 | 33.3 | |
| Total | 70 | 100.0 | 137.3 |
If you used public transport to get this help, how easy or difficult was it to get there?
| Frequency | Percent | Valid Percent | Cumulative percent | ||
| Valid | Very easy | 31 | 2.8 | 23.5 | 23.5 |
| Easy | 30 | 2.7 | 22.7 | 46.2 | |
| It is okay | 38 | 3.4 | 28.8 | 75.0 | |
| Difficult | 9 | 0.8 | 6.8 | 81.8 | |
| Very difficult | 6 | 0.5 | 4.5 | 86.4 | |
| I did not have to use public transport | 18 | 1.6 | 13.6 | 100.0 | |
| Total | 132 | 11.9 | 100.0 | ||
| Missing | No response | 975 | 88.1 | ||
| Total | 1107 | 100.0 |
Closing questions
When you are talking to someone about your learning disability, what words do you use?
| Frequency | Percent | Valid Percent | Cumulative percent | ||
| Valid | I have a learning disability | 452 | 40.8 | 66.6 | 66.6 |
| Something else | 227 | 20.5 | 33.4 | 100.0 | |
| Total | 679 | 61.3 | 100.0 | ||
| Missing | No response | 428 | 38.7 | ||
| Total | 1107 | 100.0 |
When you are talking to someone about how much support you need, what words do you use?
| Frequency | Percent | Valid Percent | Cumulative percent | ||
| Valid | I have a mild learning disability | 259 | 23.4 | 39.2 | 39.2 |
| I have a moderate learning disability | 123 | 11.1 | 18.6 | 57.9 | |
| I have a profound learning disability | 16 | 1.4 | 2.4 | 60.3 | |
| I have a severe learning disability | 70 | 6.3 | 10.6 | 70.9 | |
| Something else | 192 | 17.3 | 29.1 | 100.0 | |
| Total | 660 | 59.6 | 100.0 | ||
| Missing | No response | 447 | 40.4 | ||
| Total | 1107 | 100.0 |
Mencap connection
Mencap link
| Responses N | Percent | Percent of cases | ||
| I do not have a connection to Mencap | 184 | 7.8 | 31.5 | |
| I have heard of Mencap | 402 | 17.1 | 68.8 | |
| I fundraise for Mencap | 269 | 11.4 | 46.1 | |
| I am supported by a Mencap service A service gives people what they need, like healthcare services that help people when they are ill, and support services that give people support. | 318 | 13.5 | 54.5 | |
| I work or volunteer for Mencap | 291 | 12.4 | 49.8 | |
| I campaign A campaign is when people work together to try to change something. for Mencap | 271 | 11.5 | 46.4 | |
| I go to a Mencap local group | 313 | 13.3 | 53.6 | |
| Mencap - something else | 302 | 12.9 | 51.7 | |
| Total | 2350 | 100.0 | 402.4 |
This resource was first published December 2025
Last updated: 02.12.2025.